OK: one last post about enrollments, since the statistic that humanities degrees have dropped in half since 1970 is all over the news the last two weeks. This is going to be a bit of a data dump: but there's a shortage of data on the topic out there, so forgive me.
In my last two posts, I made two claims about that aspect of the humanities "crisis:"
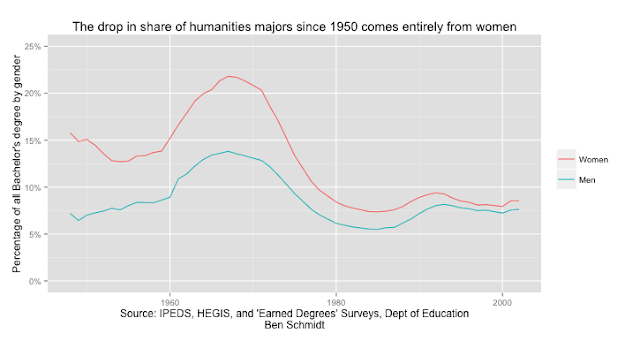
1) The biggest drop in humanities degrees relative to other degrees in the last 50 years happened between 1970 and 1985; the lower level over the last 25 years is not far out of line with pre-1960 levels of humanities majors (and far exceeds it if you account for population).
2) The entirety of the long term decline from 1950 to the present has to do with the changing majors of women, not of men.
To understand where the long-term parts of the crisis come from, that implies, you have to look at what women used to major in, and how those majors have changed. That's what this post is about.
Wednesday, June 26, 2013
Gender and the long-term decline in humanities enrollments
A quick addendum to my post on long-term enrollment trends in the humanities. (This topic seems to have legs, and I have lots more numbers sitting around I find useful, but they've got to wait for now).
David Brooks claimed in the Times, responding to the American Academy's report on the humanities and social sciences, that the humanities "commited suicide" by focusing on "class, race and gender" instead of appealing to "the earnest 19-year-old with lofty dreams of self-understanding and moral greatness." There's a lot wrong with this argument. Most of it is obvious from information already on the Internet. (David Silbey notes some of it vis-a-vis my last stats here.)
The most ironic part, though, is that hard-to-find data about the structural role of gender in university enrollments makes nonsense of Brooks' narrative that the humanities were undone by studying gender. Government bureaucrats have always been careful, though, to segregate degrees by gender in their reports.* Those are the reports I typed up to get the trend lines back to 1948 for my last post.
*I don't want to put off any earnest 19-year-olds out there: but one might argue that a persistent state interest in segregating educational achievement by gender suggests a certain degree of, shall we say, purposeful reproduction of sexual difference as a category of exclusion by the state.
If Brooks is right, one would expect a general decline in enrollments since the 1950s. But the long term results actually show that since 1950, only women have shown a major drop in the percentage of humanities majors. (And keep in mind that the college population has increased dramatically in this period: this is just about college students). Men are just as likely (7%) to major in the humanities as they were in 1950, although there was a large spike in the 1960s.

Friday, June 7, 2013
Some long term perspective on the "crisis" in humanities enrollment
 There was an article in the Wall Street Journal about low enrollments in the humanities yesterday. The heart of the story is that the humanities resemble the late Roman Empire, teetering on a collapse precipitated by their inability to get jobs like those computer scientists can provide. (Never mind that the news hook is a Harvard report about declining enrollments in the humanities, which makes pretty clear that the real problem is students who are drawn to social sciences, not competitition from computer scientists.)
But to really sell a crisis, you need some numbers. Accompanying this was a graph credited to the American Academy of Arts and Sciences showing a spectacular collapse in humanities enrollments. I happen to have made one of the first versions of this chart working there several years ago. Although it shows up in the press periodically to enforce a story of decay, some broader perspective on the data makes clear that the "Humanities in crisis" story has the wrong interpretation, the wrong baseline, and the wrong denominator.
Friday, May 24, 2013
Turning-point years in history
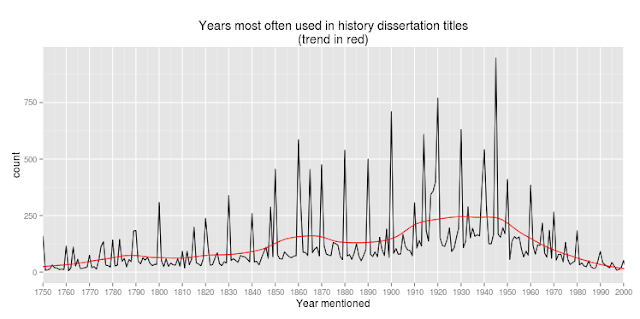
What are the major turning points in history? One way to think about that is to simply look at the most frequent dates used to start or end dissertation periods.* That gives a good sense of the general shape of time.
*For a bit more about how that works, see my post on the years covered by history dissertations: I should note I'm using a better metric now that correctly gets the end year out of text strings like "1848-61."
Here's what that list looks like: the most common year used in dissertation titles. It's extremely spiky--some years are a lot more common than are others.

Thursday, May 9, 2013
What years do historians write about?
Here's some inside baseball: the trends in periodization in history dissertations since the beginning of the American historical profession. A few months ago, Rob Townsend, who until recently kept everyone extremely well informed about professional trends at American Historical Association* sent me the list of all dissertation titles in
history the American Historical Association knows about from the last
120 years. (It's incomplete in some interesting ways, but that's a topic
for another day). It's textual data. But sometimes the most interesting
textual data to analyze quantitatively are the numbers that show up.
Using a Bookworm database, I just pulled out from the titles the any years mentioned: that lets us what periods of the past historians have been the most interested in, and what sort of periods they've described..
*Townsend is now moving on to the American Academy of Arts and Sciences, where I'm excited to see that he'll manage the Humanities Indicators—my first real programming/data project was putting together the first version of them together with Malcolm Richardson immediately after college.

Numbers between 500 and 2000 are almost always years. You can see here that the vast bulk of historical study has been in the period since 1750: the three spikes out of the landscape correspond to the Civil War and the two world wars. Output decreases in the late 20th century in large part because the data set goes back to about 1850; but as we'll see in the next chart, not entirely.
Friday, April 12, 2013
How not to topic model: an introduction for humanists.
The new issue of the Journal of Digital Humanities is up as of yesterday: it includes an article of mine, "Words Alone," on the limits of topic modeling. In true JDH practice, it draws on my two previous posts on topic modeling, here and here. If you haven't read those, the JDH article is now the place to go. (Unless you love reading prose chock full've contractions and typos. Then you can stay in the originals.) If you have read them, you might want to know what's new or why I asked the JDH editors to let me push those two articles together. In the end, the changes ended up being pretty substantial.
Friday, March 29, 2013
Patchwork Libraries
The hardest thing about studying massive quantities of digital texts is knowing just what texts you have. This is knowlege that we haven't been particularly good at collecting, or at valuing.

The post I wrote two years ago about the Google Ngram chart for 02138 (the zip code for Cambridge, MA) remains a touchstone for me because it shows the ways that materiality, copyright, and institutional decisions can produce data artifacts that are at once inscrutable and completely understandable. (Here's the chart--go read the original post for the explanation.)
Since then, I've talked a lot about the need to understand both the classification schemes for individual libraries, and the need to understand the complicated historical provenance of the digital sources we use.
What I haven't done is give a real account of the sources of the books in Bookworm. That's pretty hypocritical. I apologize. I decided some time ago to use the Open Library to provide all the metadata for Bookworm. It has very good, high-quality library metadata; but it doesn't indicate where the metadata, or the volume itself, came from. (The meta-metadata, if you will, is not great.) That's an ontological issue. Open Library describes "editions," so there's no space for a field that tells you where an individual pdf or text volume came from.
I recently loaded in this library data, though. The Internet Archive web site, which stores the actual books, does say where a particular volume comes from. So with a little behind the scenes magic, it's pretty easy to get that into the database in some form.
I've been learning some D3 mock up a possible multi-dimensional interfaces to the Bookworm data through the API. (If you come to the Bookworm booth at the DPLA meeting next month, you can play with this as well as some new projects others in the lab have been building on the platform).
Using that, it's possible to quickly mock up a chart of the... (drumroll)...
The temporal patterns are more interesting. The 1922 cutoff line is the dominant visual feature of the chart--the extremely different composition of the lending libraries after that date (MIT and Montana State suddenly become important players, while sources like Cal and the LOC vanish). This is why comparisons across 1922 are never safe, even when the numbers seem big enough. But the complicated nature of the copyright line and scanning policies is also clear: for Canadiana.org, it's 1900, and for Oxford, it seems to be in the 1880s. There are clearly some metadata problems, as well (I think a lot of those post-1922 Harvard books are misattributed).
There are also a lot of strange little clusters of intense collection. Duke and the Lincoln Financial collection have massive spikes from about 1861-1865; the Boston Public Library seems to have an abnormal number of books right around 1620 and 1776. Those are specifically historical collections that will affect the sort of conclusions one can draw from aggregate data, much like the questions I was asking about a Google presentation that purported to show that more history was published in revolutionary times). Although oddly enough, the first few BPL volumes from 1620 I checked were in French or Latin--it's not quite the model of founding charters that I expected.
The digital libraries we're building are immense patchworks. That means they have seams. It's possible to tell stories that rest lightly across the many elements. But push too hard in the wrong direction, and conclusions can unravel. I don't think that any conclusions I've made in the past are unsettled by knowing where the books came from--although that Oxford dropoff has me wondering what might happen to transatlantic comparisons. But I'm glad to be able to see it, and so wanted to share. This is something we need to do.
And this isn't an issue particular to just Bookworm, although it does have a slightly more tangled line of transmission than some other libraries. Here, for example, are the top 16 libraries in the Hathi trust catalog from 1780 to 1820, scraped from their web catalog. 1800 is not a year that dramatically changes the publication history of books; but it is a year that librarians will use for their own arbitrary purposes. For instance, a book published in 1799 is considerably more likely to have been "rare" and therefore off limits to the Google scanners in the period of book scanning, I'd bet anything, just because human beings use rules of thumb like that; or in the period that university libraries were being built, acquisition policies may have been quite different for pre-1800 vs post-1800 texts in various genres. ("Don't buy any science books written before 1800" would be a sensible policy to adopt in 1870, for example. Almost all the libraries here would not have bought the bulk of their 1799 collections in the year 1799.)
I pulled out the year 1800 (1800 and 1900 are both massive spikes where all sorts of unknown books can be filed). That also serves to highlight the gaps from 1799 to 1801; they're sometimes quite significant. What you see here are the same sort of seams and discontinuities as in Bookworm, albeit on a smaller scale. The number of volumes from NYPL, Cal, and Harvard double overnight; other libraries, like Michigan and Madrid, seem not to show any pattern. If Michigan and California collect different sorts of books, this can cause major headaches for comparisons across the line.
There's no grand lesson here. Or if there is, it's just the old one: know your sources. But as a public service announcement, it's worth making again and again.

The post I wrote two years ago about the Google Ngram chart for 02138 (the zip code for Cambridge, MA) remains a touchstone for me because it shows the ways that materiality, copyright, and institutional decisions can produce data artifacts that are at once inscrutable and completely understandable. (Here's the chart--go read the original post for the explanation.)
Since then, I've talked a lot about the need to understand both the classification schemes for individual libraries, and the need to understand the complicated historical provenance of the digital sources we use.
What I haven't done is give a real account of the sources of the books in Bookworm. That's pretty hypocritical. I apologize. I decided some time ago to use the Open Library to provide all the metadata for Bookworm. It has very good, high-quality library metadata; but it doesn't indicate where the metadata, or the volume itself, came from. (The meta-metadata, if you will, is not great.) That's an ontological issue. Open Library describes "editions," so there's no space for a field that tells you where an individual pdf or text volume came from.
I recently loaded in this library data, though. The Internet Archive web site, which stores the actual books, does say where a particular volume comes from. So with a little behind the scenes magic, it's pretty easy to get that into the database in some form.
I've been learning some D3 mock up a possible multi-dimensional interfaces to the Bookworm data through the API. (If you come to the Bookworm booth at the DPLA meeting next month, you can play with this as well as some new projects others in the lab have been building on the platform).
Using that, it's possible to quickly mock up a chart of the... (drumroll)...
Library origins of the books in Bookworm. (Most common libraries only)
 |
| Click to enlarge |
The colors are on a log scale here, and each little line represents a single combination of a library and year. So a red horizontal band is an area where a library has contributed hundreds of books to the Internet Archive (and therefore Bookworm) each year, a yellow to orange band means dozens of books a year, and the areas of scattered green show libraries that only contribute a volume or two every few years. I only show the most common libraries.
What can we see here? The number one contributor is the University of California Libraries. (No surprise). The Robarts library at the University of Toronto is number two--that's only surprising to me because there have been so few books published in Canada when I've segmented by country. Most of the other large libraries are the ones you would expect—both some of the big university/Google partner libraries (Harvard, Oxford, Michigan, NYPL) and a few free agents who scanned on their own or in cooperation with the Internet Archive (Library of Congress, Boston Public (I think)).
The temporal patterns are more interesting. The 1922 cutoff line is the dominant visual feature of the chart--the extremely different composition of the lending libraries after that date (MIT and Montana State suddenly become important players, while sources like Cal and the LOC vanish). This is why comparisons across 1922 are never safe, even when the numbers seem big enough. But the complicated nature of the copyright line and scanning policies is also clear: for Canadiana.org, it's 1900, and for Oxford, it seems to be in the 1880s. There are clearly some metadata problems, as well (I think a lot of those post-1922 Harvard books are misattributed).
There are also a lot of strange little clusters of intense collection. Duke and the Lincoln Financial collection have massive spikes from about 1861-1865; the Boston Public Library seems to have an abnormal number of books right around 1620 and 1776. Those are specifically historical collections that will affect the sort of conclusions one can draw from aggregate data, much like the questions I was asking about a Google presentation that purported to show that more history was published in revolutionary times). Although oddly enough, the first few BPL volumes from 1620 I checked were in French or Latin--it's not quite the model of founding charters that I expected.
The digital libraries we're building are immense patchworks. That means they have seams. It's possible to tell stories that rest lightly across the many elements. But push too hard in the wrong direction, and conclusions can unravel. I don't think that any conclusions I've made in the past are unsettled by knowing where the books came from--although that Oxford dropoff has me wondering what might happen to transatlantic comparisons. But I'm glad to be able to see it, and so wanted to share. This is something we need to do.
And this isn't an issue particular to just Bookworm, although it does have a slightly more tangled line of transmission than some other libraries. Here, for example, are the top 16 libraries in the Hathi trust catalog from 1780 to 1820, scraped from their web catalog. 1800 is not a year that dramatically changes the publication history of books; but it is a year that librarians will use for their own arbitrary purposes. For instance, a book published in 1799 is considerably more likely to have been "rare" and therefore off limits to the Google scanners in the period of book scanning, I'd bet anything, just because human beings use rules of thumb like that; or in the period that university libraries were being built, acquisition policies may have been quite different for pre-1800 vs post-1800 texts in various genres. ("Don't buy any science books written before 1800" would be a sensible policy to adopt in 1870, for example. Almost all the libraries here would not have bought the bulk of their 1799 collections in the year 1799.)
 |
| Click to enlarge |
There's no grand lesson here. Or if there is, it's just the old one: know your sources. But as a public service announcement, it's worth making again and again.
Thursday, February 28, 2013
Canonic authors and the pronouns that they used
My last post had the aggregate statistics about which parts of the library have more female characters. (Relatively). But in some ways, it's more interesting to think about the ratio of male and female pronouns in terms of authors whom we already know. So I thought I'd look for the ratios of gendered pronouns in the most-collected authors of the late 19th and early twentieth centuries, to see what comes out.
On the one hand, I don't want to claim too much for this: anyone can go to a library and see that Washington Irving doesn't write female characters. But as one of many possible exercises in reducing down the size of the library to rethink the broad aspects of the literary canon, c. 1910, I do think it's suggestive; and, as I'll suggest towards the end, knowing these practical details can help us explore the instability of 'subject' or 'genre' as expressed by the librarians who choose where to put these books on the shelves.
On the one hand, I don't want to claim too much for this: anyone can go to a library and see that Washington Irving doesn't write female characters. But as one of many possible exercises in reducing down the size of the library to rethink the broad aspects of the literary canon, c. 1910, I do think it's suggestive; and, as I'll suggest towards the end, knowing these practical details can help us explore the instability of 'subject' or 'genre' as expressed by the librarians who choose where to put these books on the shelves.
Monday, February 25, 2013
Genders and Genres: tracking pronouns
Now back to some texts for a bit. Last spring, I posted a few times about the possibilities for reading genders in large collections of books. I didn't follow up because I have some concerns about just what to do with this sort of pronoun data. But after talking about it to Ryan Cordell's class at Northeastern last week, I wanted to think a little bit more about the representation of male and female subjects in late-19th century texts. Further spurs were Matt Jockers recently posted the pronoun usage in his corpus of novels; Jeana Jorgensen pointed to recent research by Kathleen Ragan that suggests that editorial and teller effects have a massive effect on the gender of protagonists in folk tales. Bookworm gives a great platform for looking at this sort of question.
Thursday, February 14, 2013
Anachronism patterns suggest there's nothing special about words
I'm cross-posting here a piece from my language anachronisms blog, Prochronisms.
It won't appear the language blog for a week or two, to keep the posting schedule there more regular. But I wanted to put it here now, because it ties directly into the conversation in my last post about whether words are the atomic units of languages. The presumption of some physics inflected linguistics research is that it is. I was putting forward the claim that it's actually Ngrams of any length. This question is closely tied to the definition of what a 'word' is (although as I said in the comments, I think statistical regularities tend to happen at a level that no one would ever call a 'word,' however broad a definition they take).
The piece from Prochronisms is about whether writers have a harder time avoiding anachronisms when they appear as parts of multi-word phrases. Anachronisms are a great test case for observing what writers know about language. Writers are trying to talk as if they're from the past; but--and this is fundamental point I've been making over there--it's all but impossible for them to succeed. So by looking at failures, we can see at what level writers "know" language. If there's something special about words, we might expect them to know more about words than phrases. But if--as these preliminary data seem to indicate--users of language don't seem to have any special knowledge of individual words, that calls into question cognitive accounts of changes in language, like the one the physicists offered, that rely on some fixed 'vocabulary' limit that is enumerated in unigrams.
Anyhow, here's the Prochronisms post:
Wednesday, February 6, 2013
Are words the atomic unit of a dynamic system?
My last post was about how the frustrating imprecisions of language drive humanists towards using statistical aggregates instead of words: this one is about how they drive scientists to treat words as fundamental units even when their own models suggest they should be using something more abstract.
I've been thinking about a recent article by Alexander M. Petersen et al., "Languages cool as they expand: Allometric scaling and the decreasing need for new words." The paper uses Ngrams data to establish the dynamics for the entry of new words into natural languages. Mark Liberman argues that the bulk of change in the Ngrams corpus involves things like proper names and alphanumeric strings, rather than actual vocabulary change, which keeps the paper from being more than 'though-provoking.' Liberman's fundamental objection is that although the authors say they are talking about 'words,' it would be better for them to describe their findings in terms of 'tokens.' Words seem good and basic, but dissolve on close inspection into a forest of inflected forms, capitals, and OCR mis-readings. So it's hard to know whether the conclusions really apply to 'words' even if they do to 'tokens.'
I've been thinking about a recent article by Alexander M. Petersen et al., "Languages cool as they expand: Allometric scaling and the decreasing need for new words." The paper uses Ngrams data to establish the dynamics for the entry of new words into natural languages. Mark Liberman argues that the bulk of change in the Ngrams corpus involves things like proper names and alphanumeric strings, rather than actual vocabulary change, which keeps the paper from being more than 'though-provoking.' Liberman's fundamental objection is that although the authors say they are talking about 'words,' it would be better for them to describe their findings in terms of 'tokens.' Words seem good and basic, but dissolve on close inspection into a forest of inflected forms, capitals, and OCR mis-readings. So it's hard to know whether the conclusions really apply to 'words' even if they do to 'tokens.'
Thursday, January 10, 2013
Crossroads
Just a quick post to point readers of this blog to my new Atlantic article on anachronisms in Kushner/Spielberg's Lincoln; and to direct Atlantic readers interested in more anachronisms over to my other blog, Prochronisms, which is currently churning on through the new season of Downton Abbey. (And to stick around here; my advanced market research shows you might like some of the posts about mapping historical shipping routes.)
Wednesday, January 9, 2013
Keeping the words in Topic Models
Following up on my previous topic modeling post, I want to talk about one thing humanists actually do with topic models once they build them, most of the time: chart the topics over time. Since I think that, although Topic Modeling can be very useful, there's too little skepticism about the technique, I'm venturing to provide it (even with, I'm sure, a gross misunderstanding or two). More generally, the sort of mistakes temporal changes cause should call into question the complacency with which humanists tend to 'topics' in topic modeling as stable abstractions, and argue for a much greater attention to the granular words that make up a topic model.
In the middle of this, I will briefly veer into some odd reflections about how the post-lapsarian state of language. Some people will want to skip that; maybe some others will want to skip to it.
In the middle of this, I will briefly veer into some odd reflections about how the post-lapsarian state of language. Some people will want to skip that; maybe some others will want to skip to it.
Subscribe to:
Posts (Atom)