*For a bit more about how that works, see my post on the years covered by history dissertations: I should note I'm using a better metric now that correctly gets the end year out of text strings like "1848-61."
Here's what that list looks like: the most common year used in dissertation titles. It's extremely spiky--some years are a lot more common than are others.

The results here won't be particularly surprising to historians (who know that--for instance--there are far more studies out the American academy that touch on the First World War than the French Revolution). For non-historians, it may be a useful reminder of just how modern-leaning a field history is. The average (ie, median) dissertation ends only about 40 years before its author was born. We're not talking about the distant past.
So: are those peaks turning points? In some ways: but they're also round numbers. If you asked me to list the most significant dates in US history, I would rattle off a list of realignment elections, economic panics, and wars. (Off the top of my head: 1763, 1776, 1789, 1800, 1828, 1861, 1865, 1876, 1896, 1914, 1929, 1945, 1968, 1980, 2008). But the most common dates here, on the other hand, are 1945, 1920, and 1900. Those are 1) round numbers and 2) years from the early 20th century, the most heavily researched period in history dissertations.
To get the most historically interesting years, I'm accounting for the round number effect and the year effect, by making a linear model of divergence from trend based on whether the number is divisible by 5, 10, 50, or 100. Each year starts at 70% of the baseline: if it ends in five, it comes in at 130%, all the way up to ~500% of the predicted value for century marks. (To make the model legible, I'm not declaring a century as also being a pentade and halfcentury--but each coefficient does still need to have the intercept added to it.). In case you're the sort of person who likes to inspect coefficients:
Coefficients: Estimate Std. Error t value Pr(>|t|) (Intercept) 0.6902 0.0360 19.174 < 2e-16 *** pentadeTRUE 0.5718 0.1082 5.287 2.18e-07 *** decadeTRUE 2.2235 0.1192 18.652 < 2e-16 *** fiftyTRUE 3.3071 0.3552 9.311 < 2e-16 *** centuryTRUE 4.4430 0.3081 14.420 < 2e-16 ***Residual standard error: 0.612 on 356 degrees of freedom Multiple R-squared: 0.6347, Adjusted R-squared: 0.6306 F-statistic: 154.7 on 4 and 356 DF, p-value: < 2.2e-16
That gives us a baseline to compare the most interesting years setting aside their roundness.
So what is the biggest turning point of them all? Over all the dissertations I have (and starting from 1650), the year that most exceeds its baseline expectation is 1763. That basically makes sense: 1763 is a way of signaling that a dissertation captures the run up to the American revolution (US history is a significant portion of the whole), while grabbing any Seven Years' War dissertations as well. But it's a bit surprising, as well: 1650 to 2000 is roughly the Modern period in history departments, and the biggest break of all should be, I'd think, at 1789 (which in Europe conventionally separates early modern from late modern, and marks the first year under the Constitution in the United States). And 1776 is lower than you would expect in part because it's so well known: "1775" is used quite a bit, probably as a shorthand for "before the revolution."
The next most common is 1914. That one is completely sensible as the end of the long nineteenth century and the start of the Great War. (Although it is a bit strange that Americanists tend to use it so much--after all, we didn't enter the war for three years). It's probably because any year from 1917 (the Russian Revolution) to 1920 (when most of the provisions of Versailles went into effect) might make sense as a start or end date for a dissertation bookended by the war. The rest of the top years are below--the higher it is, the more distinctively it stands out from its surroundings.

That raises an important point: different years are associated with different periods.
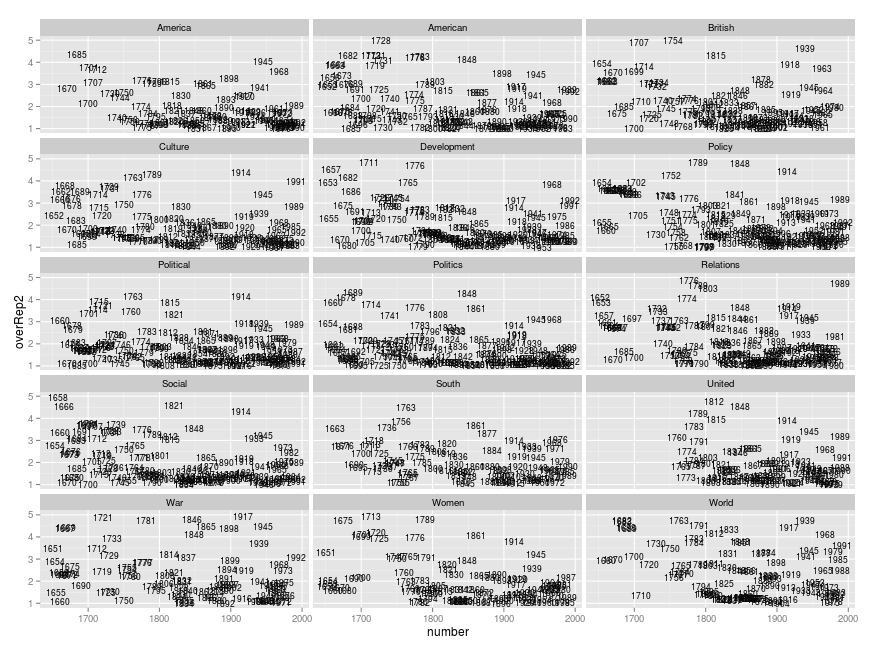
The most interesting thing about this is not the years: it's the overall shape. "War" dissertations are naturally bunchy: there are ten years over-represented by at least 4x. "Culture," on the other hand, has only three: 1789, 1914, and 1763. You can see that a number of decades-marks are elevated for culture (1750, 1830, 1820, etc): that's because unlike war dissertation, culture dissertations tend to punt on exact dates and take the general route.
There's more that can be done with this sort of information--we could see if some years are more prone to be start dates or end dates. (The most "start-y" year, it turns out, is 1607 (Jamestown), and the most "end-y" is 1705 (something about Virginia?)). But what I'm going to take out of this post, honestly, are most a new set of grid marks for historical charts.

Here, for instance, the ticks at 1919 and 1945 are right on the beginning of a long-term rise: that's because 1919 and 1945 are important years for the production of history dissertations. They're more germaine tick marks than the decades would be. Most of the time, the additional benefit in sense of having good years like this won't be worth much. (And I don't know why 2002--loess smoothing, which I'm using, gets weird at the edges. Probably it's best just to consider 1989 the End of History). Ticks right at the decades make interpolation easier, which generally should make the difference. But there are some cases--like my next post--where it's helpful to know what years might actually make a difference.
In case you want something similar: here's a set of replacements for decades derived from history dissertation titles. I'll even put it as JSON, just in case. After 1861, for better or worse, there's very little overlap between my subjective list and this one here; before, there's quite a bit.
Replacements for decades:
[1660,1682,1689,1715,1727,1754,1763,1776,1783,1789,1815,1821,1848,1861,1898,1914,1919,1933,1939,1945,1968,1989,2002]
Replacements for half centuries:
[1660,1689,1763,1789,1821,1848,1914,1945]
For centuries, the algorithm recommends [1763,1848,1914]. That shows the limitations with my algorithm, here. I would never use that because I think 1789 is better than 1763; it's possible that dropping out the over-representation of American topics would make this work better. And there's no end to the 20th century, because the algorithm I'm using can't find a stable end date after 1914 (1989 is worse than 1968 is worse than 1945 is worse than 1939, etc.)
All right. Stay tuned for the actual use of these tick marks, in looking at the inner contours of historical periods.
No comments:
Post a Comment